In materials analysis, the challenge isn’t just identifying what’s there—it’s figuring out how much is there. That’s where micro X-ray Fluorescence (microXRF) shines, leveraging the power of Fundamental Parameters (FP) to deliver precise and non-destructive quantification of materials. But how does it stack up against other analytical methods like atomic spectroscopy? And what are the dos and don’ts of microXRF quantification? Let’s dive into the science of getting the numbers just right!
What Are Fundamental Parameters (FP) and Why Do They Matter?
Fundamental Parameters (FP) are mathematical models used to account for physical effects like X-ray attenuation, absorption, and enhancement within a sample. Instead of requiring an exact match of reference standards for every sample type, FP-based quantification estimates elemental concentrations by correcting for matrix effects based on known physical constants. The result? Quantification that is:
✅ Standard-less (Sort of! More on that later…) ✅ Non-destructive ✅ Accurate for a wide range of materials ✅ Capable of analyzing irregular or unknown samples
FP-based quantification makes microXRF particularly powerful for rapid screening applications, forensic analysis, and industrial quality control, where sample prep should be minimal and repeatability is key.
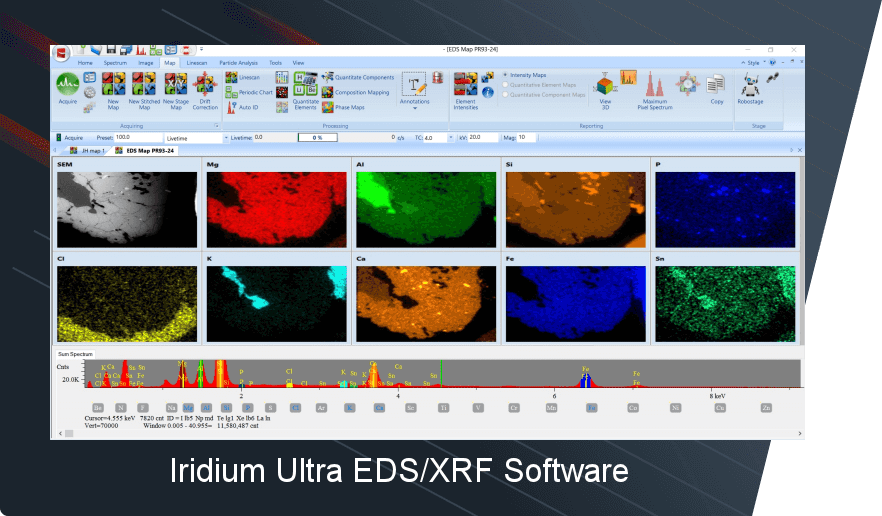
Additionally, microXRF allows for the visualization of elemental distributions by displaying results as 2D maps, where higher intensity corresponds to higher concentrations of the analyzed element. This mapping capability provides crucial insights into material heterogeneity, helping researchers and engineers pinpoint localized variations in composition with high spatial resolution.
Why microXRF? A Look at the Competition
Many analytical techniques promise elemental quantification, so why choose microXRF? Let’s see how it compares:
| Technique | Detection Limits | Sample Prep | Speed | Matrix Effects | Non-Destructive? |
| microXRF | ppm-% | Minimal | Fast | Handled by FP | Yes |
| Atomic Absorption | ppb range | Dissolution Required | Moderate | High | No |
| ICP-OES | ppb-ppm | Digestion Needed | Moderate | High | No |
| ICP-MS | ppt-ppm | Extensive | Slow | High | No |
| SEM-EDS | ~0.1 wt%-% | Conductive Coating | Fast | Significant | No |
While atomic spectroscopy techniques such as ICP-MS and ICP-OES offer better sensitivity, they require complex sample digestion, high maintenance, and can only analyze liquids. microXRF, however, allows for direct solid, liquid, and even gas analysis without extensive preparation.
The Dos and Don’ts of microXRF Quantification
✅ Do: Calibrate for your specific application—while FP is powerful, properly chosen calibration standards improve accuracy. ✅ Do: Use appropriate measurement conditions, including correct filters and voltage settings, to optimize sensitivity for your elements of interest. ✅ Do: Understand detection limits—microXRF is powerful but has limitations on light elements (Z < 11) without vacuum or helium.
❌ Don’t: Assume FP alone is enough—real-world samples often contain complex matrices that benefit from empirical corrections. ❌ Don’t: Ignore sample uniformity—heterogeneous samples may require mapping or multiple measurement points to ensure accuracy. ❌ Don’t: Overlook contamination—surface impurities or matrix interferences can affect accuracy.
Boosting Accuracy: The Role of Standards
While FP provides a strong foundation, using well-matched standards significantly enhances microXRF quantification. Reference materials help fine-tune matrix corrections, correct for instrument drift, and improve reproducibility. Standards can be:
📌 Single-element pure standards – Ideal for instrument calibration.
📌 Matrix-matched standards – Best for improving accuracy in complex materials.
📌 Certified Reference Materials (CRMs) – Provide traceable, high-accuracy benchmarks for regulatory compliance.
MicroXRF vs. SEM-EDS: A Battle of the Beams
Both microXRF and SEM-EDS provide localized elemental analysis, but microXRF brings some distinct advantages:
| Feature | microXRF | SEM-EDS |
| X-ray Source | High-energy X-rays | Electron Beam |
| Penetration Depth | ~10s – 100s of microns | ~1 micron |
| Spot Size | ~5 – 150 microns | <1 micron |
| Sample Prep | Minimal | Conductive Coating Required |
| Vacuum Needed? | No | Yes |
Why Choose microXRF?
✅ Better for bulk analysis due to deeper penetration.
✅ No need for vacuum—ideal for biological, geological, and industrial samples.
✅ Handles non-conductive materials without coating.
✅ Provides elemental distribution maps for detailed spatial analysis.
While SEM-EDS is superior for ultra-fine structures (sub-micron resolution), microXRF delivers more robust quantification and is better suited for heterogeneous or irregularly shaped samples.
ZAF vs. FP: The Quantification Showdown
MicroXRF systems may use different quantification approaches, such as ZAF correction (Z: atomic number, A: absorption, F: fluorescence) or Fundamental Parameters (FP).
📌 ZAF correction: Requires known standards and works best when comparing samples to well-characterized reference materials.
📌 FP method: Works well for unknowns and minimizes the need for extensive standards, making it more flexible.
While ZAF excels in high-precision applications with a well-defined dataset, FP’s adaptability makes it ideal for routine industrial and research applications where sample compositions vary widely.
Final Thoughts: Is microXRF Right for You?
If you need a non-destructive and efficient quantification technique with minimal sample preparation, microXRF offers a reliable solution. It enables analysis of various materials, from metals, ceramics, polymers, semiconductors & microelectronics, and even biological samples, using Fundamental Parameters to quantify composition. Additionally, microXRF provides spatial resolution to examine material heterogeneity through 2D elemental maps.
Need help optimizing your XRF analysis? Contact IXRF Systems, and let’s make every element count!